earthpy.plot
Functionality around spatial plotting.
- earthpy.plot.colorbar(mapobj, size='3%', pad=0.09)[source]
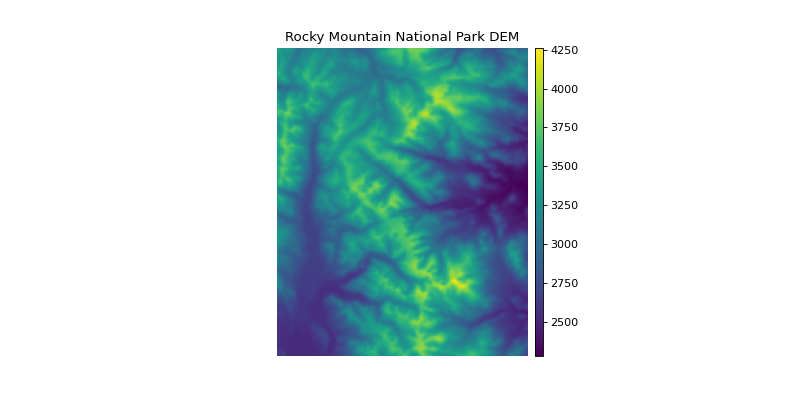
Adjust colorbar height to match the matplotlib axis height.
NOTE: This function requires matplotlib v 3.0.1 or greater or v 2.9 or lower to run properly.
- Parameters
mapobj (matplotlib axis object) – The image that the colorbar will be representing as a matplotlib axis object.
size (char (default = "3%")) – The percent width of the colorbar relative to the plot.
pad (int (default = 0.09)) – The space between the plot and the color bar.
- Returns
Matplotlib color bar object with the correct width that matches the y-axis height.
- Return type
matplotlib.pyplot.colorbar
Examples
>>> import matplotlib.pyplot as plt
>>> import rasterio as rio
>>> import earthpy.plot as ep
>>> from earthpy.io import path_to_example
>>> with rio.open(path_to_example('rmnp-dem.tif')) as src:
...     dem = src.read()
...     fig, ax = plt.subplots(figsize = (10, 5))
>>> im = ax.imshow(dem.squeeze())
>>> ep.colorbar(im)
<matplotlib.colorbar.Colorbar object at 0x...>
>>> ax.set(title="Rocky Mountain National Park DEM")
[Text(...'Rocky Mountain National Park DEM')]
>>> ax.set_axis_off()
>>> plt.show()
(Source code, png, hires.png, pdf)
- earthpy.plot.draw_legend(im_ax, bbox=(1.05, 1), titles=None, cmap=None, classes=None)[source]
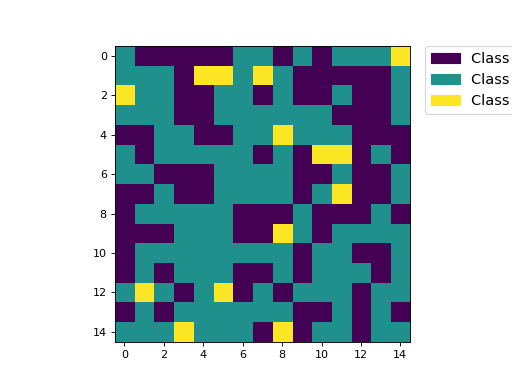
Create a custom legend with a box for each class in a raster.
- Parameters
im_ax (matplotlib image object) – This is the image returned from a call to imshow().
bbox (tuple (default = (1.05, 1))) – This is the bbox_to_anchor argument that will place the legend anywhere on or around your plot.
titles (list (optional)) – A list of a title or category for each unique value in your raster. This is the label that will go next to each box in your legend. If nothing is provided, a generic “Category x” will be populated.
cmap (str (optional)) – Colormap name to be used for legend items.
classes (list (optional)) – A list of unique values found in the numpy array that you wish to plot.
- Returns
A matplotlib legend object to be placed on the plot.
- Return type
matplotlib.pyplot.legend
Example
>>> import numpy as np
>>> import earthpy.plot as ep
>>> import matplotlib.pyplot as plt
>>> im_arr = np.random.uniform(-2, 1, (15, 15))
>>> bins = [-np.Inf, -0.8, 0.8, np.Inf]
>>> im_arr_bin = np.digitize(im_arr, bins)
>>> cat_names = ["Class 1", "Class 2", "Class 3"]
>>> f, ax = plt.subplots()
>>> im = ax.imshow(im_arr_bin, cmap="gnuplot")
>>> im_ax = ax.imshow(im_arr_bin)
>>> leg_neg = ep.draw_legend(im_ax = im_ax, titles = cat_names)
>>> plt.show()
(Source code, png, hires.png, pdf)
- earthpy.plot.hist(arr, colors=['purple'], figsize=(12, 12), cols=2, bins=20, title=None, xlabel='', ylabel='', hist_range=None, alpha=1)[source]
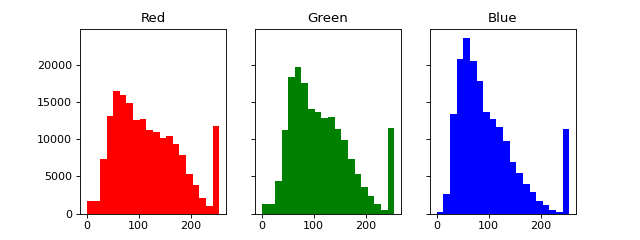
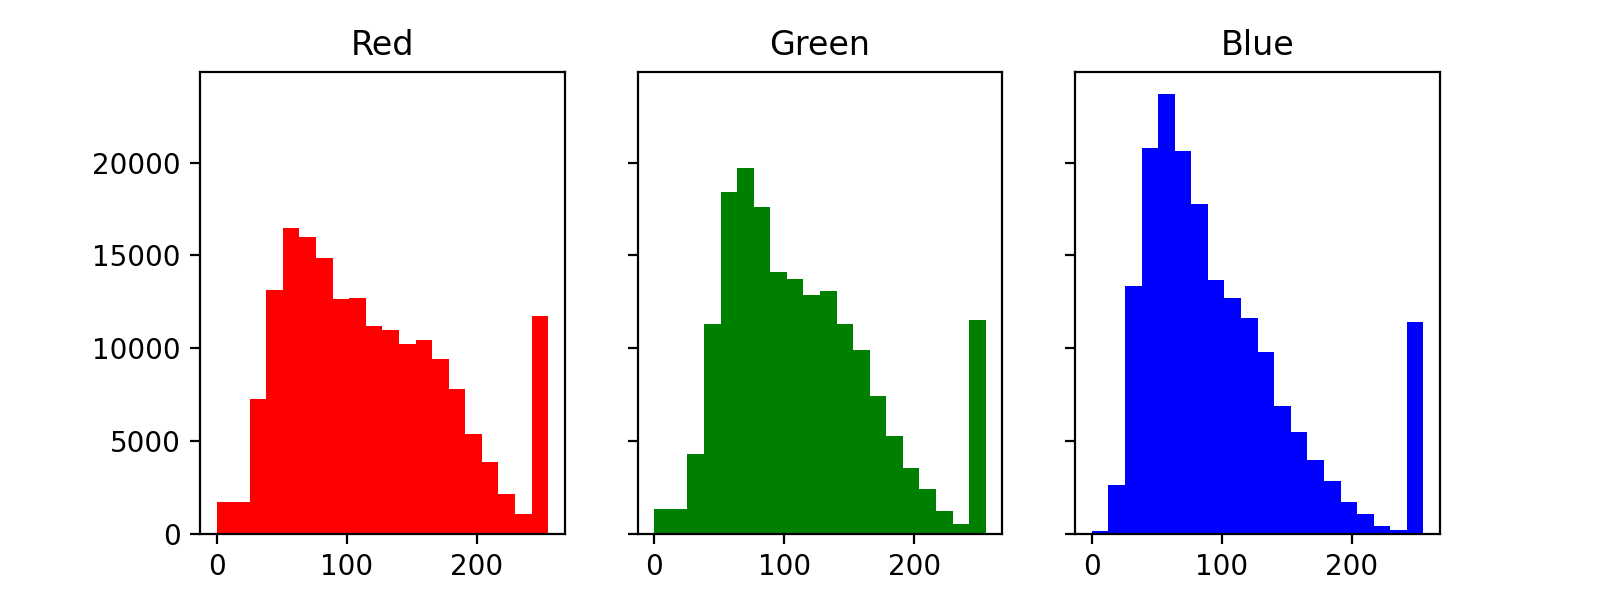
Plot histogram for each layer in a numpy array.
- Parameters
arr (numpy array) – An n-dimensional numpy array from which n histograms will be plotted.
colors (list (default = ["purple"])) – A list of color values that should either equal the number of bands or be a single color.
figsize (tuple (default = (12, 12))) – The x and y integer dimensions of the output plot.
cols (int (default = 2)) – The number of columns for plot grid.
bins (int or list (default = 20)) – The number of bins to generate for the histogram or a list of break points for each bin following matplotlib ax.hist documentation.
title (str or list (optional)) – A list of title values that should either equal the number of bands or be empty. A string is accepted for a single dimension array.
xlabel (str (optional)) – The text to print on the x axis.
ylabel (str (optional)) – The text to print on the y axis.
hist_range (tuple (optional)) – The lower and upper range of the bins. Lower and upper outliers are ignored. If not provided, range is (x.min(), x.max()). Range has no effect if bins is a sequence.
alpha (float (optional)) – The alpha value for the plot. This will help adjust the transparency of the plot to the desired level.
- Returns
- figfigure object
The figure object associated with the histogram.
- ax or axsax or axes object
The axes object(s) associated with the histogram.
- Return type
tuple
Example
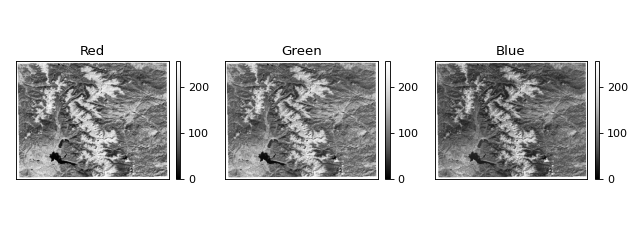
>>> import matplotlib.pyplot as plt
>>> import rasterio as rio
>>> import earthpy.plot as ep
>>> from earthpy.io import path_to_example
>>> with rio.open(path_to_example('rmnp-rgb.tif')) as src:
...     img_array = src.read()
>>> ep.hist(img_array,
...     colors=['r', 'g', 'b'],
...     title=['Red', 'Green', 'Blue'],
...     cols=3,
...     figsize=(8, 3))
(<Figure size 800x300 with 3 Axes>, ...)
(Source code, png, hires.png, pdf)

- earthpy.plot.make_col_list(unique_vals, nclasses=None, cmap=None)[source]
Convert a matplotlib named colormap into a discrete list of n-colors in RGB format.
- Parameters
unique_vals (list) – A list of values to make a color list from.
nclasses (int (optional)) – The number of classes.
cmap (str (optional)) – Colormap name used to create output list.
- Returns
A list of colors based on the given set of values in matplotlib format.
- Return type
list
Example
>>> import numpy as np
>>> import earthpy.plot as ep
>>> import matplotlib.pyplot as plt
>>> arr = np.array([[1, 2], [3, 4], [5, 4], [5, 5]])
>>> f, ax = plt.subplots()
>>> im = ax.imshow(arr, cmap="Blues")
>>> the_legend = ep.draw_legend(im_ax=im)
>>> # Get the array and cmap from axis object
>>> cmap_name = im.axes.get_images()[0].get_cmap().name
>>> unique_vals = list(np.unique(im.get_array().data))
>>> cmap_colors = ep.make_col_list(unique_vals, cmap=cmap_name)
- earthpy.plot.plot_bands(arr, cmap='Greys_r', figsize=(12, 12), cols=3, title=None, extent=None, cbar=True, scale=False, vmin=None, vmax=None, ax=None, alpha=1, norm=None)[source]
Plot each band in a numpy array in its own axis.
Assumes band order (band, row, col).
- Parameters
arr (numpy array) – An n-dimensional numpy array to plot.
cmap (str (default = "Greys_r")) – Colormap name for plots.
figsize (tuple (default = (12, 12))) – Figure size in inches.
cols (int (default = 3)) – Number of columns for plot grid.
title (str or list (optional)) – Title of one band or list of titles with one title per band.
extent (tuple (optional)) – Bounding box that the data will fill: (minx, miny, maxx, maxy).
cbar (Boolean (default = True)) – Turn off colorbar if needed.
scale (Boolean (Default = False)) – Turn off bytescale scaling if needed.
vmin (Int (Optional)) – Specify the vmin to scale imshow() plots.
vmax (Int (Optional)) – Specify the vmax to scale imshow() plots.
alpha (float (optional)) – The alpha value for the plot. This will help adjust the transparency of the plot to the desired level.
norm (matplotlib Normalize object (Optional)) – The normalized boundaries for custom values coloring. NOTE: For this argument to work, the scale argument MUST be set to false. Because of this, the function will automatically set scale to false, even if the user manually sets scale to true.
- Returns
ax or axs – The axes object(s) associated with the plot.
- Return type
matplotlib.axes._subplots.AxesSubplot object(s)
Example
>>> import matplotlib.pyplot as plt
>>> import earthpy.plot as ep
>>> from earthpy.io import path_to_example
>>> import rasterio as rio
>>> titles = ['Red', 'Green', 'Blue']
>>> with rio.open(path_to_example('rmnp-rgb.tif')) as src:
...     ep.plot_bands(src.read(),
...                   title=titles,
...                   figsize=(8, 3))
array([<AxesSubplot:title={'center':'Red'}>...
(Source code, png, hires.png, pdf)
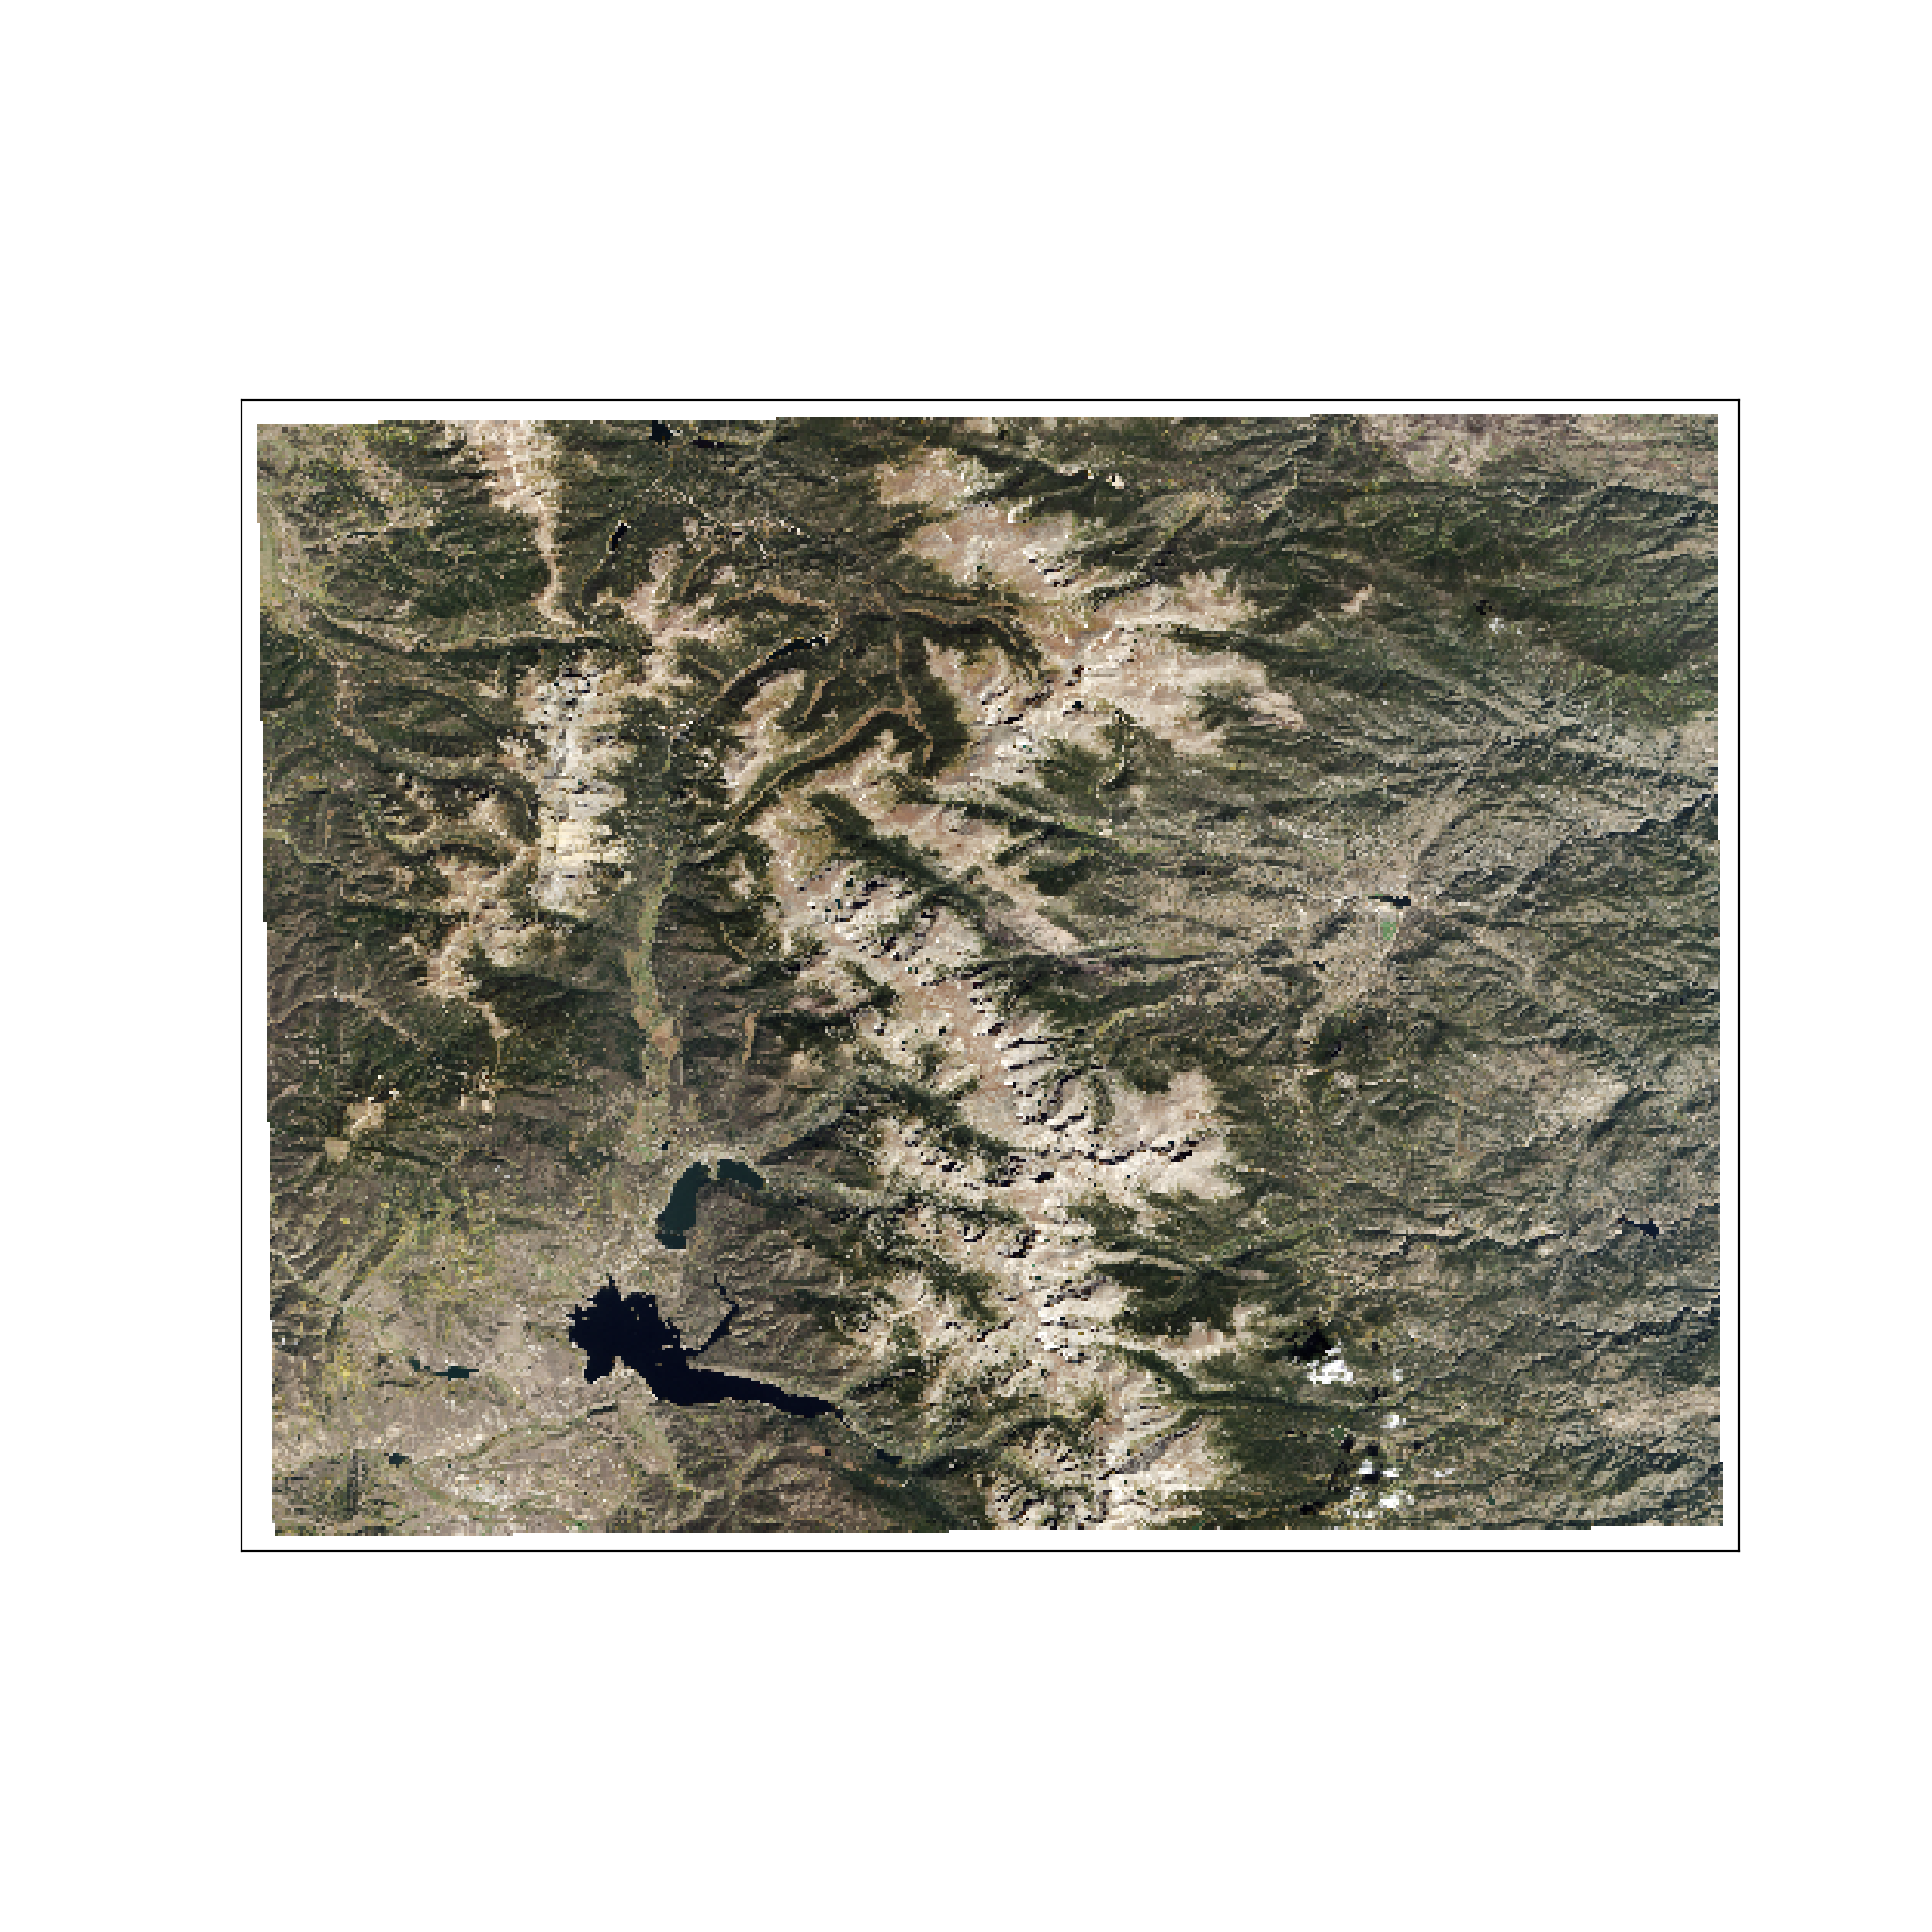
- earthpy.plot.plot_rgb(arr, rgb=(0, 1, 2), figsize=(10, 10), str_clip=2, ax=None, extent=None, title='', stretch=None)[source]
Plot three bands in a numpy array as a composite RGB image.
- Parameters
arr (numpy array) – An n-dimensional array in rasterio band order (bands, rows, columns) containing the layers to plot.
rgb (list (default = (0, 1, 2))) – Indices of the three bands to be plotted.
figsize (tuple (default = (10, 10)) – The x and y integer dimensions of the output plot.
str_clip (int (default = 2)) – The percentage of clip to apply to the stretch. Default = 2 (2 and 98).
ax (object (optional)) – The axes object where the ax element should be plotted.
extent (tuple (optional)) – The extent object that matplotlib expects (left, right, bottom, top).
title (string (optional)) – The intended title of the plot.
stretch (Boolean (optional)) – Application of a linear stretch. If set to True, a linear stretch will be applied.
- Returns
ax – The axes object associated with the 3 band image.
- Return type
axes object
Example
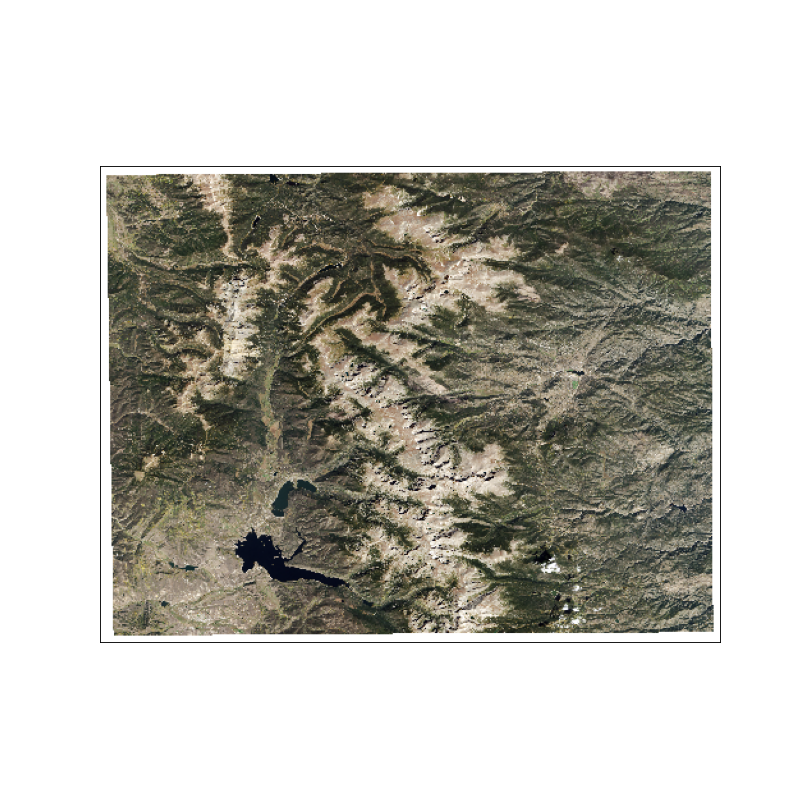
>>> import matplotlib.pyplot as plt
>>> import rasterio as rio
>>> import earthpy.plot as ep
>>> from earthpy.io import path_to_example
>>> with rio.open(path_to_example('rmnp-rgb.tif')) as src:
...     img_array = src.read()
>>> # Ensure the input array doesn't have nodata values like -9999
>>> ep.plot_rgb(img_array)
<AxesSubplot:>
(Source code, png, hires.png, pdf)
