earthpy.spatial
Functions to manipulate spatial raster and vector data.
-
earthpy.spatial.bytescale(data, high=255, low=0, cmin=None, cmax=None)[source]¶ Byte scales an array (image).
Byte scaling converts the input image to uint8 dtype, and rescales the data range to
(low, high)(default 0-255). If the input image already has dtype uint8, no scaling is done. Source code adapted from scipy.misc.bytescale (deprecated in scipy-1.0.0)- Parameters
data (numpy array) – image data array.
high (int (default=255)) – Scale max value to high.
low (int (default=0)) – Scale min value to low.
cmin (int (optional)) – Bias scaling of small values. Default is
data.min().cmax (int (optional)) – Bias scaling of large values. Default is
data.max().
- Returns
img_array – The byte-scaled array.
- Return type
uint8 numpy array
Examples
>>> import numpy as np
>>> from earthpy.spatial import bytescale
>>> img = np.array([[ 91.06794177,   3.39058326,  84.4221549 ],
...                 [ 73.88003259,  80.91433048,   4.88878881],
...                 [ 51.53875334,  34.45808177,  27.5873488 ]])
>>> bytescale(img)
array([[255,   0, 236],
       [205, 225,   4],
       [140,  90,  70]], dtype=uint8)
>>> bytescale(img, high=200, low=100)
array([[200, 100, 192],
       [180, 188, 102],
       [155, 135, 128]], dtype=uint8)
>>> bytescale(img, cmin=0, cmax=255)
array([[255,   0, 236],
       [205, 225,   4],
       [140,  90,  70]], dtype=uint8)
-
earthpy.spatial.crop_image(raster, geoms, all_touched=True)[source]¶ Crop a single file using geometry objects.
- Parameters
raster (rasterio object) – The rasterio object to be cropped.
geoms (geopandas geodataframe or list of polygons) – The spatial polygon boundaries in GeoJSON-like dict format to be used to crop the image. All data outside of the polygon boundaries will be set to nodata and/or removed from the image.
all_touched (bool (default=True)) – Include a pixel in the mask if it touches any of the shapes. If False, include a pixel only if its center is within one of the shapes, or if it is selected by Bresenham’s line algorithm. (from rasterio)
- Returns
- out_image: cropped numpy array
A numpy array that is cropped to the geoms object extent with shape (bands, rows, columns)
- out_meta: dict
A dictionary containing updated metadata for the cropped raster, including extent (shape elements) and transform properties.
- Return type
tuple
Example
>>> import geopandas as gpd
>>> import rasterio as rio
>>> import earthpy.spatial as es
>>> from earthpy.io import path_to_example
>>> # Clip an RGB image to the extent of Rocky Mountain National Park
>>> rmnp = gpd.read_file(path_to_example("rmnp.shp"))
>>> with rio.open(path_to_example("rmnp-rgb.tif")) as raster:
...     src_image = raster.read()
...     out_image, out_meta = es.crop_image(raster, rmnp)
>>> out_image.shape
(3, 265, 281)
>>> src_image.shape
(3, 373, 485)
-
earthpy.spatial.extent_to_json(ext_obj)[source]¶ Convert bounds to a shapely geojson like spatial object.
This format is what shapely uses. The output object can be used to crop a raster image.
- Parameters
ext_obj (list or geopandas geodataframe) – If provided with a geopandas geodataframe, the extent will be generated from that. Otherwise, extent values should be in the order: minx, miny, maxx, maxy.
- Returns
extent_json (A GeoJSON style dictionary of corner coordinates)
for the extent – A GeoJSON style dictionary of corner coordinates representing the spatial extent of the provided spatial object.
Example
>>> import geopandas as gpd
>>> import earthpy.spatial as es
>>> from earthpy.io import path_to_example
>>> rmnp = gpd.read_file(path_to_example('rmnp.shp'))
>>> es.extent_to_json(rmnp)
{'type': 'Polygon', 'coordinates': (((-105.4935937, 40.1580827), ...),)}
-
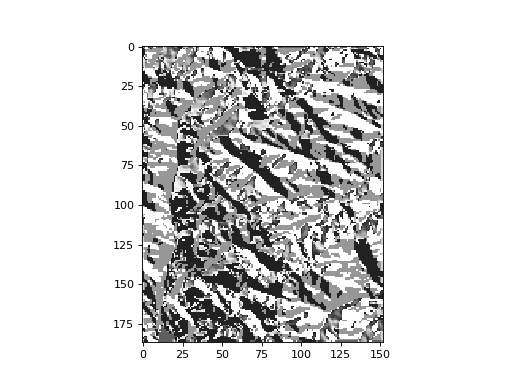
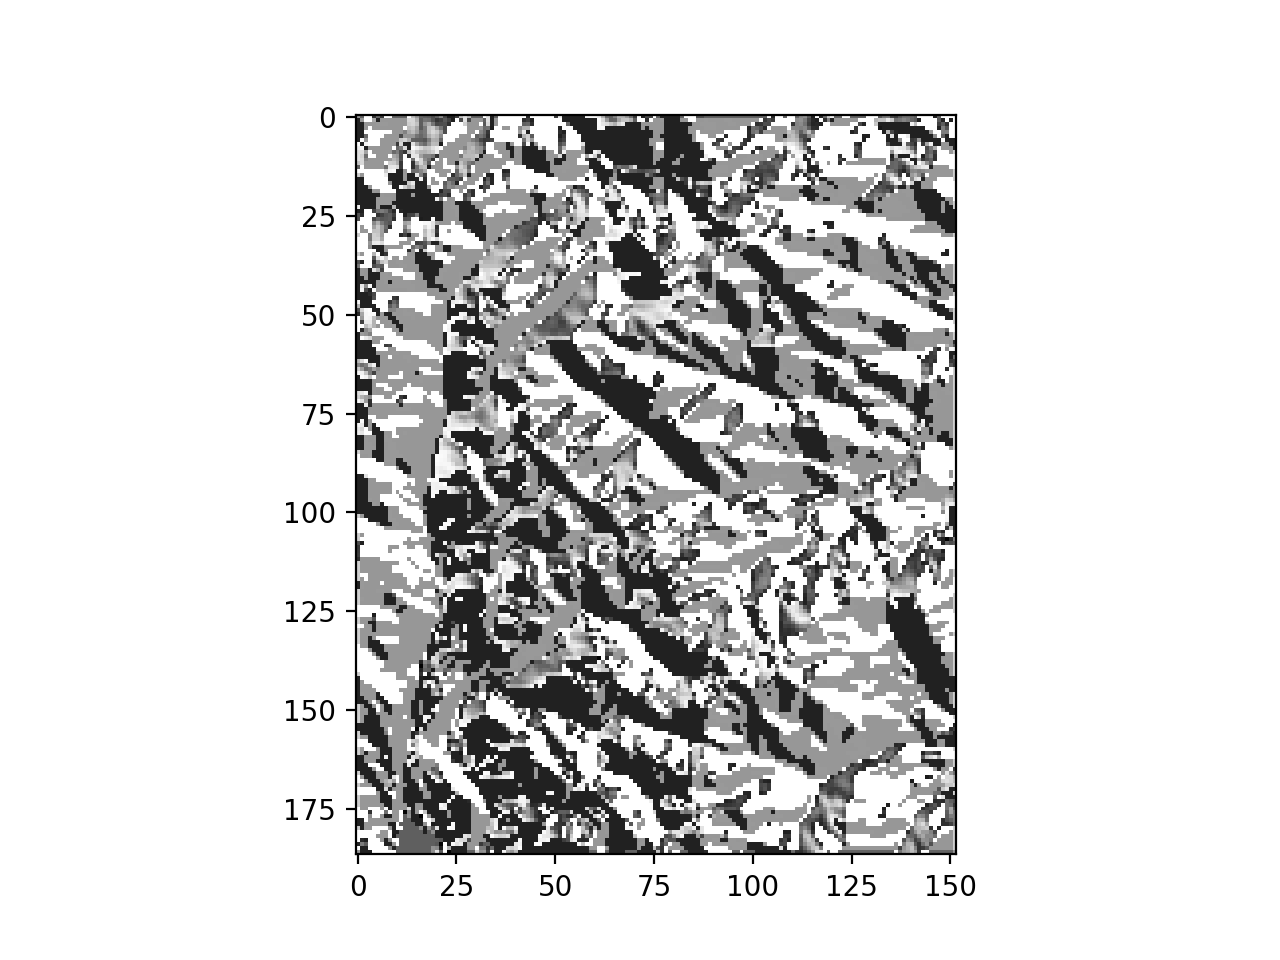
earthpy.spatial.hillshade(arr, azimuth=30, angle_altitude=30)[source]¶ Create hillshade from a numpy array containing elevation data.
- Parameters
arr (numpy array of shape (rows, columns)) – Numpy array containing elevation values to be used to created hillshade.
azimuth (float (default=30)) – The desired azimuth for the hillshade.
angle_altitude (float (default=30)) – The desired sun angle altitude for the hillshade.
- Returns
A numpy array containing hillshade values.
- Return type
numpy array
Example
>>> import matplotlib.pyplot as plt
>>> import rasterio as rio
>>> import earthpy.spatial as es
>>> from earthpy.io import path_to_example
>>> with rio.open(path_to_example('rmnp-dem.tif')) as src:
...     dem = src.read()
>>> print(dem.shape)
(1, 187, 152)
>>> squeezed_dem = dem.squeeze() # remove first dimension
>>> print(squeezed_dem.shape)
(187, 152)
>>> shade = es.hillshade(squeezed_dem)
>>> plt.imshow(shade, cmap="Greys")
<matplotlib.image.AxesImage object at 0x...>
(Source code, png, hires.png, pdf)

-
earthpy.spatial.normalized_diff(b1, b2)[source]¶ Take two n-dimensional numpy arrays and calculate the normalized difference.
Math will be calculated (b1-b2) / (b1 + b2).
- Parameters
b2 (b1,) – Two numpy arrays that will be used to calculate the normalized difference. Math will be calculated (b1-b2) / (b1+b2).
- Returns
n_diff – The element-wise result of (b1-b2) / (b1+b2) calculation. Inf values are set to nan. Array returned as masked if result includes nan values.
- Return type
numpy array
Examples
>>> import numpy as np
>>> import earthpy.spatial as es
>>> # Calculate normalized difference vegetation index
>>> nir_band = np.array([[6, 7, 8, 9, 10], [16, 17, 18, 19, 20]])
>>> red_band = np.array([[1, 2, 3, 4, 5], [11, 12, 13, 14, 15]])
>>> ndvi = es.normalized_diff(b1=nir_band, b2=red_band)
>>> ndvi
array([[0.71428571, 0.55555556, 0.45454545, 0.38461538, 0.33333333],
       [0.18518519, 0.17241379, 0.16129032, 0.15151515, 0.14285714]])
>>> # Calculate normalized burn ratio
>>> nir_band = np.array([[8, 10, 13, 17, 15], [18, 20, 22, 23, 25]])
>>> swir_band = np.array([[6, 7, 8, 9, 10], [16, 17, 18, 19, 20]])
>>> nbr = es.normalized_diff(b1=nir_band, b2=swir_band)
>>> nbr
array([[0.14285714, 0.17647059, 0.23809524, 0.30769231, 0.2       ],
       [0.05882353, 0.08108108, 0.1       , 0.0952381 , 0.11111111]])
-
earthpy.spatial.stack(band_paths, out_path='', nodata=None)[source]¶ Convert a list of raster paths into a raster stack numpy darray.
- Parameters
band_paths (list of file paths) – A list with paths to the bands to be stacked. Bands will be stacked in the order given in this list.
out_path (string (optional)) – A path with a file name for the output stacked raster tif file.
nodata (numeric (optional)) – A value (int or float) that represents invalid or missing values to mask in the output.
- Returns
- numpy array
N-dimensional array created by stacking the raster files provided.
- rasterio profile object
A rasterio profile object containing the updated spatial metadata for the stacked numpy array.
- Return type
tuple
Example
>>> import os
>>> import earthpy.spatial as es
>>> from earthpy.io import path_to_example
>>> band_fnames = ["red.tif", "green.tif", "blue.tif"]
>>> band_paths = [path_to_example(fname) for fname in band_fnames]
>>> destfile = "./stack_result.tif"
>>> arr, arr_meta = es.stack(band_paths, destfile)
>>> arr.shape
(3, 373, 485)
>>> os.path.isfile(destfile)
True
>>> # optionally, clean up example output
>>> os.remove(destfile)