earthpy.plot
Functionality around spatial plotting.
-
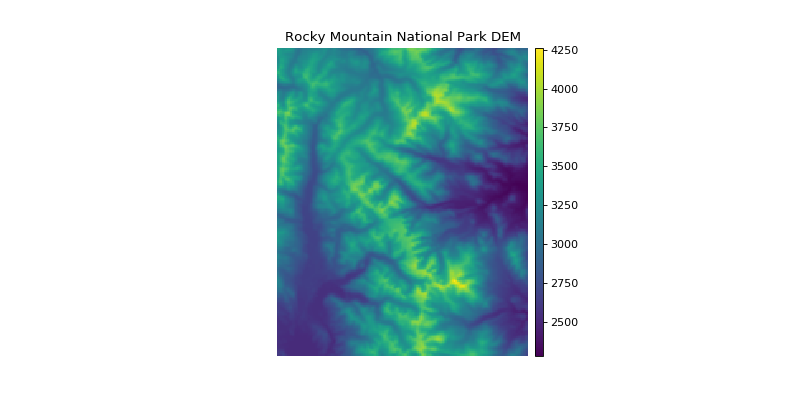
earthpy.plot.colorbar(mapobj, size='3%', pad=0.09)[source]¶ Adjust colorbar height to match the matplotlib axis height.
NOTE: This function requires matplotlib v 3.0.1 or greater or v 2.9 or lower to run properly.
- Parameters
mapobj (matplotlib axis object) – The image that the colorbar will be representing as a matplotlib axis object.
size (char (default = "3%")) – The percent width of the colorbar relative to the plot.
pad (int (default = 0.09)) – The space between the plot and the color bar.
- Returns
Matplotlib color bar object with the correct width that matches the y-axis height.
- Return type
matplotlib.pyplot.colorbar
Examples
>>> import matplotlib.pyplot as plt
>>> import rasterio as rio
>>> import earthpy.plot as ep
>>> from earthpy.io import path_to_example
>>> with rio.open(path_to_example('rmnp-dem.tif')) as src:
...     dem = src.read()
...     fig, ax = plt.subplots(figsize = (10, 5))
>>> im = ax.imshow(dem.squeeze())
>>> ep.colorbar(im)
<matplotlib.colorbar.Colorbar object at 0x...>
>>> ax.set(title="Rocky Mountain National Park DEM")
[Text(...'Rocky Mountain National Park DEM')]
>>> ax.set_axis_off()
>>> plt.show()
(Source code, png, hires.png, pdf)

-
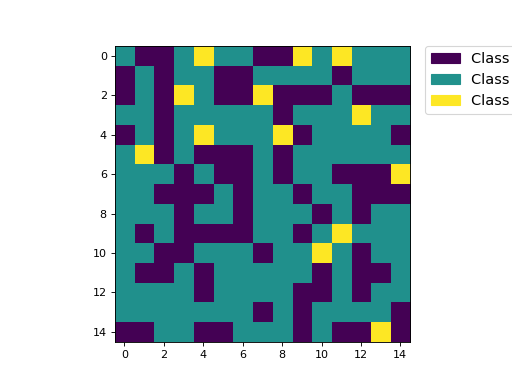
earthpy.plot.draw_legend(im_ax, bbox=(1.05, 1), titles=None, cmap=None, classes=None)[source]¶ Create a custom legend with a box for each class in a raster.
- Parameters
im_ax (matplotlib image object) – This is the image returned from a call to imshow().
bbox (tuple (default = (1.05, 1))) – This is the bbox_to_anchor argument that will place the legend anywhere on or around your plot.
titles (list (optional)) – A list of a title or category for each unique value in your raster. This is the label that will go next to each box in your legend. If nothing is provided, a generic “Category x” will be populated.
cmap (str (optional)) – Colormap name to be used for legend items.
classes (list (optional)) – A list of unique values found in the numpy array that you wish to plot.
- Returns
A matplotlib legend object to be placed on the plot.
- Return type
matplotlib.pyplot.legend
Example
>>> import numpy as np
>>> import earthpy.plot as ep
>>> import matplotlib.pyplot as plt
>>> im_arr = np.random.uniform(-2, 1, (15, 15))
>>> bins = [-np.Inf, -0.8, 0.8, np.Inf]
>>> im_arr_bin = np.digitize(im_arr, bins)
>>> cat_names = ["Class 1", "Class 2", "Class 3"]
>>> f, ax = plt.subplots()
>>> im = ax.imshow(im_arr_bin, cmap="gnuplot")
>>> im_ax = ax.imshow(im_arr_bin)
>>> leg_neg = ep.draw_legend(im_ax = im_ax, titles = cat_names)
>>> plt.show()
(Source code, png, hires.png, pdf)

-
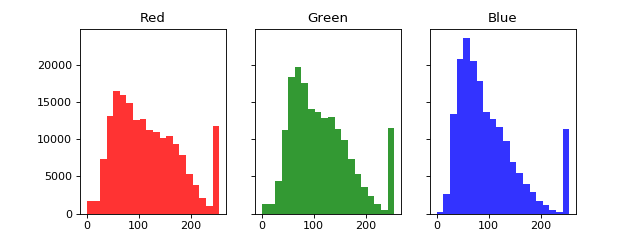
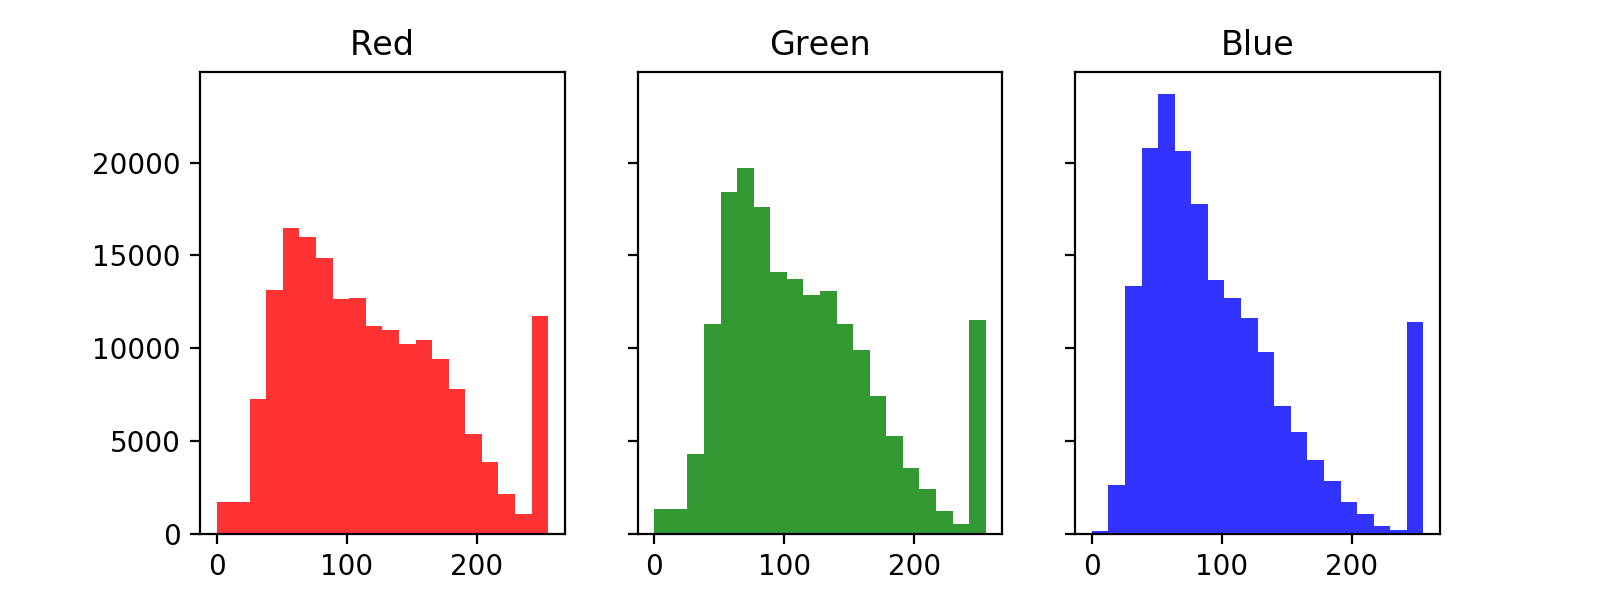
earthpy.plot.hist(arr, colors=['purple'], figsize=(12, 12), cols=2, bins=20, title=None, xlabel='', ylabel='', hist_range=None)[source]¶ Plot histogram for each layer in a numpy array.
- Parameters
arr (numpy array) – An n-dimensional numpy array from which n histograms will be plotted.
colors (list (default = ["purple"])) – A list of color values that should either equal the number of bands or be a single color.
figsize (tuple (default = (12, 12))) – The x and y integer dimensions of the output plot.
cols (int (default = 2)) – The number of columns for plot grid.
bins (int or list (default = 20)) – The number of bins to generate for the histogram or a list of break points for each bin following matplotlib ax.hist documentation.
title (str or list (optional)) – A list of title values that should either equal the number of bands or be empty. A string is accepted for a single dimension array.
xlabel (str (optional)) – The text to print on the x axis.
ylabel (str (optional)) – The text to print on the y axis.
hist_range (tuple (optional)) – The lower and upper range of the bins. Lower and upper outliers are ignored. If not provided, range is (x.min(), x.max()). Range has no effect if bins is a sequence.
- Returns
- figfigure object
The figure object associated with the histogram.
- ax or axsax or axes object
The axes object(s) associated with the histogram.
- Return type
tuple
Example
>>> import matplotlib.pyplot as plt
>>> import rasterio as rio
>>> import earthpy.plot as ep
>>> from earthpy.io import path_to_example
>>> with rio.open(path_to_example('rmnp-rgb.tif')) as src:
...     img_array = src.read()
>>> ep.hist(img_array,
...     colors=['r', 'g', 'b'],
...     title=['Red', 'Green', 'Blue'],
...     cols=3,
...     figsize=(8, 3))
(<Figure size 800x300 with 3 Axes>, ...)
(Source code, png, hires.png, pdf)
-
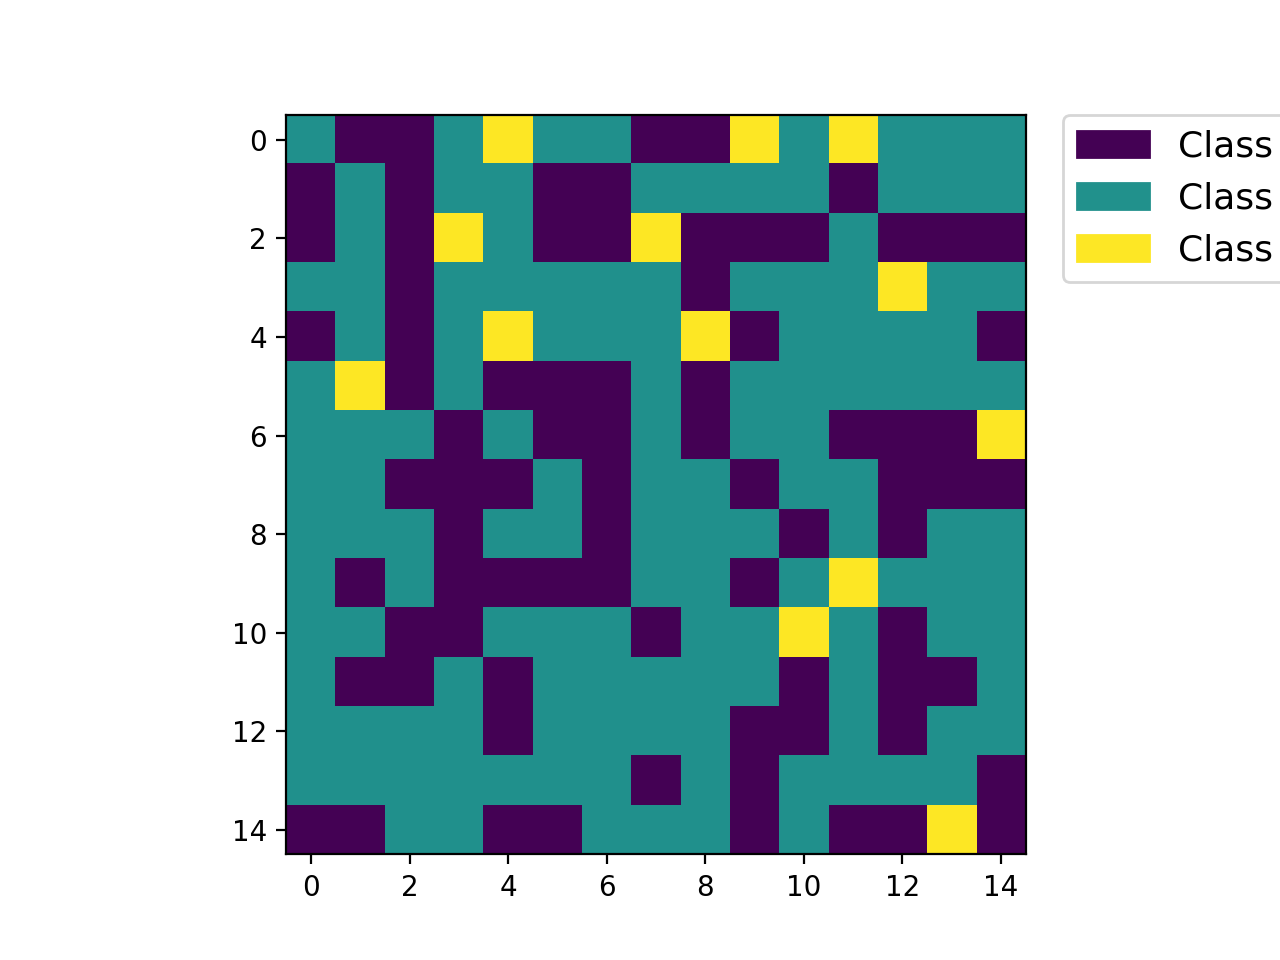
earthpy.plot.make_col_list(unique_vals, nclasses=None, cmap=None)[source]¶ Convert a matplotlib named colormap into a discrete list of n-colors in RGB format.
- Parameters
unique_vals (list) – A list of values to make a color list from.
nclasses (int (optional)) – The number of classes.
cmap (str (optional)) – Colormap name used to create output list.
- Returns
A list of colors based on the given set of values in matplotlib format.
- Return type
list
Example
>>> import numpy as np
>>> import earthpy.plot as ep
>>> import matplotlib.pyplot as plt
>>> arr = np.array([[1, 2], [3, 4], [5, 4], [5, 5]])
>>> f, ax = plt.subplots()
>>> im = ax.imshow(arr, cmap="Blues")
>>> the_legend = ep.draw_legend(im_ax=im)
>>> # Get the array and cmap from axis object
>>> cmap_name = im.axes.get_images()[0].get_cmap().name
>>> unique_vals = list(np.unique(im.get_array().data))
>>> cmap_colors = ep.make_col_list(unique_vals, cmap=cmap_name)
-
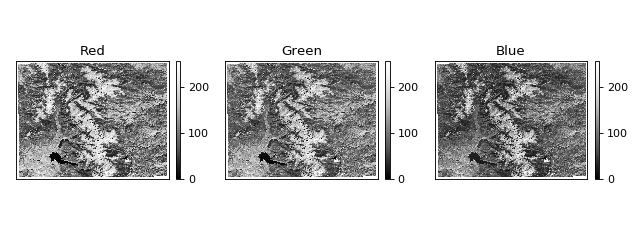
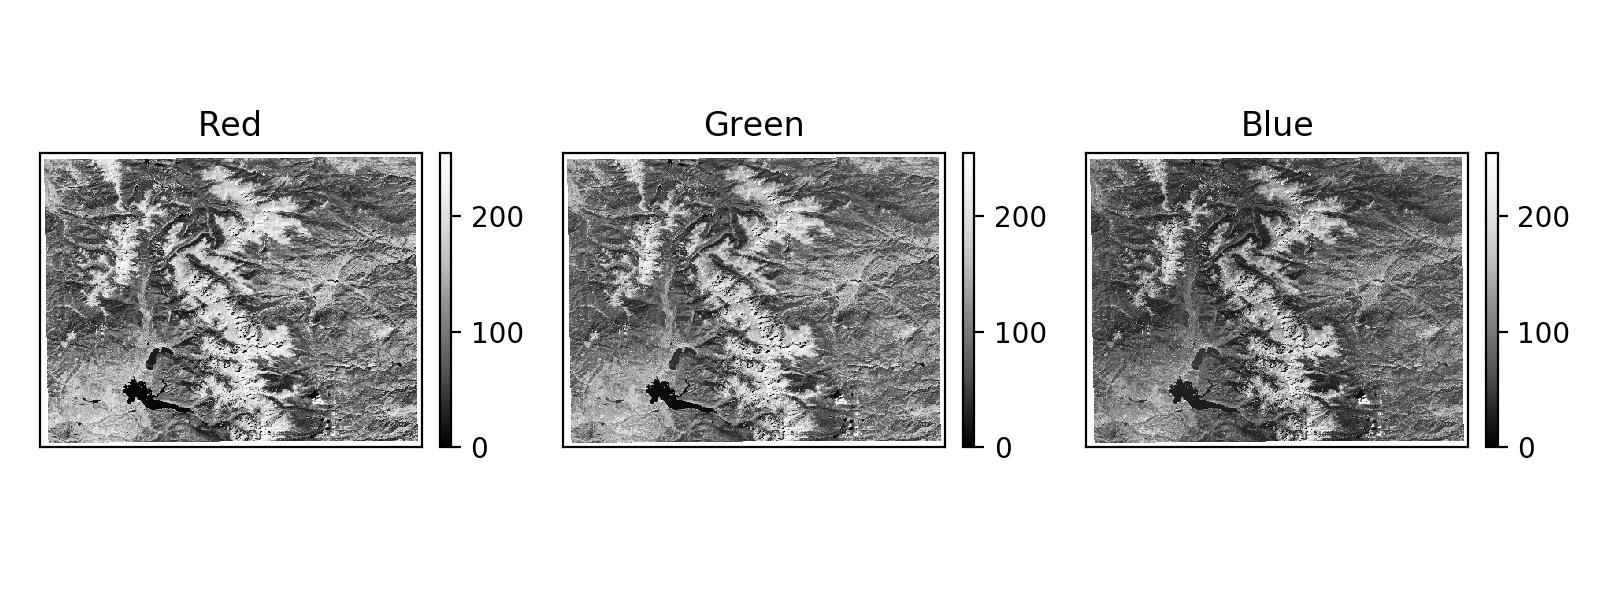
earthpy.plot.plot_bands(arr, cmap='Greys_r', figsize=(12, 12), cols=3, title=None, extent=None, cbar=True, scale=True, vmin=None, vmax=None, ax=None)[source]¶ Plot each band in a numpy array in its own axis.
Assumes band order (band, row, col).
- Parameters
arr (numpy array) – An n-dimensional numpy array to plot.
cmap (str (default = "Greys_r")) – Colormap name for plots.
figsize (tuple (default = (12, 12))) – Figure size in inches.
cols (int (default = 3)) – Number of columns for plot grid.
title (str or list (optional)) – Title of one band or list of titles with one title per band.
extent (tuple (optional)) – Bounding box that the data will fill: (minx, miny, maxx, maxy).
cbar (Boolean (default = True)) – Turn off colorbar if needed.
scale (Boolean (Default = True)) – Turn off bytescale scaling if needed.
vmin (Int (Optional)) – Specify the vmin to scale imshow() plots.
vmax (Int (Optional)) – Specify the vmax to scale imshow() plots.
- Returns
ax or axs – The axes object(s) associated with the plot.
- Return type
matplotlib.axes._subplots.AxesSubplot object(s)
Example
>>> import matplotlib.pyplot as plt
>>> import earthpy.plot as ep
>>> from earthpy.io import path_to_example
>>> import rasterio as rio
>>> titles = ['Red', 'Green', 'Blue']
>>> with rio.open(path_to_example('rmnp-rgb.tif')) as src:
...     ep.plot_bands(src.read(),
...                   title=titles,
...                   figsize=(8, 3))
array([<matplotlib.axes._subplots.AxesSubplot object at 0x...
(Source code, png, hires.png, pdf)
-
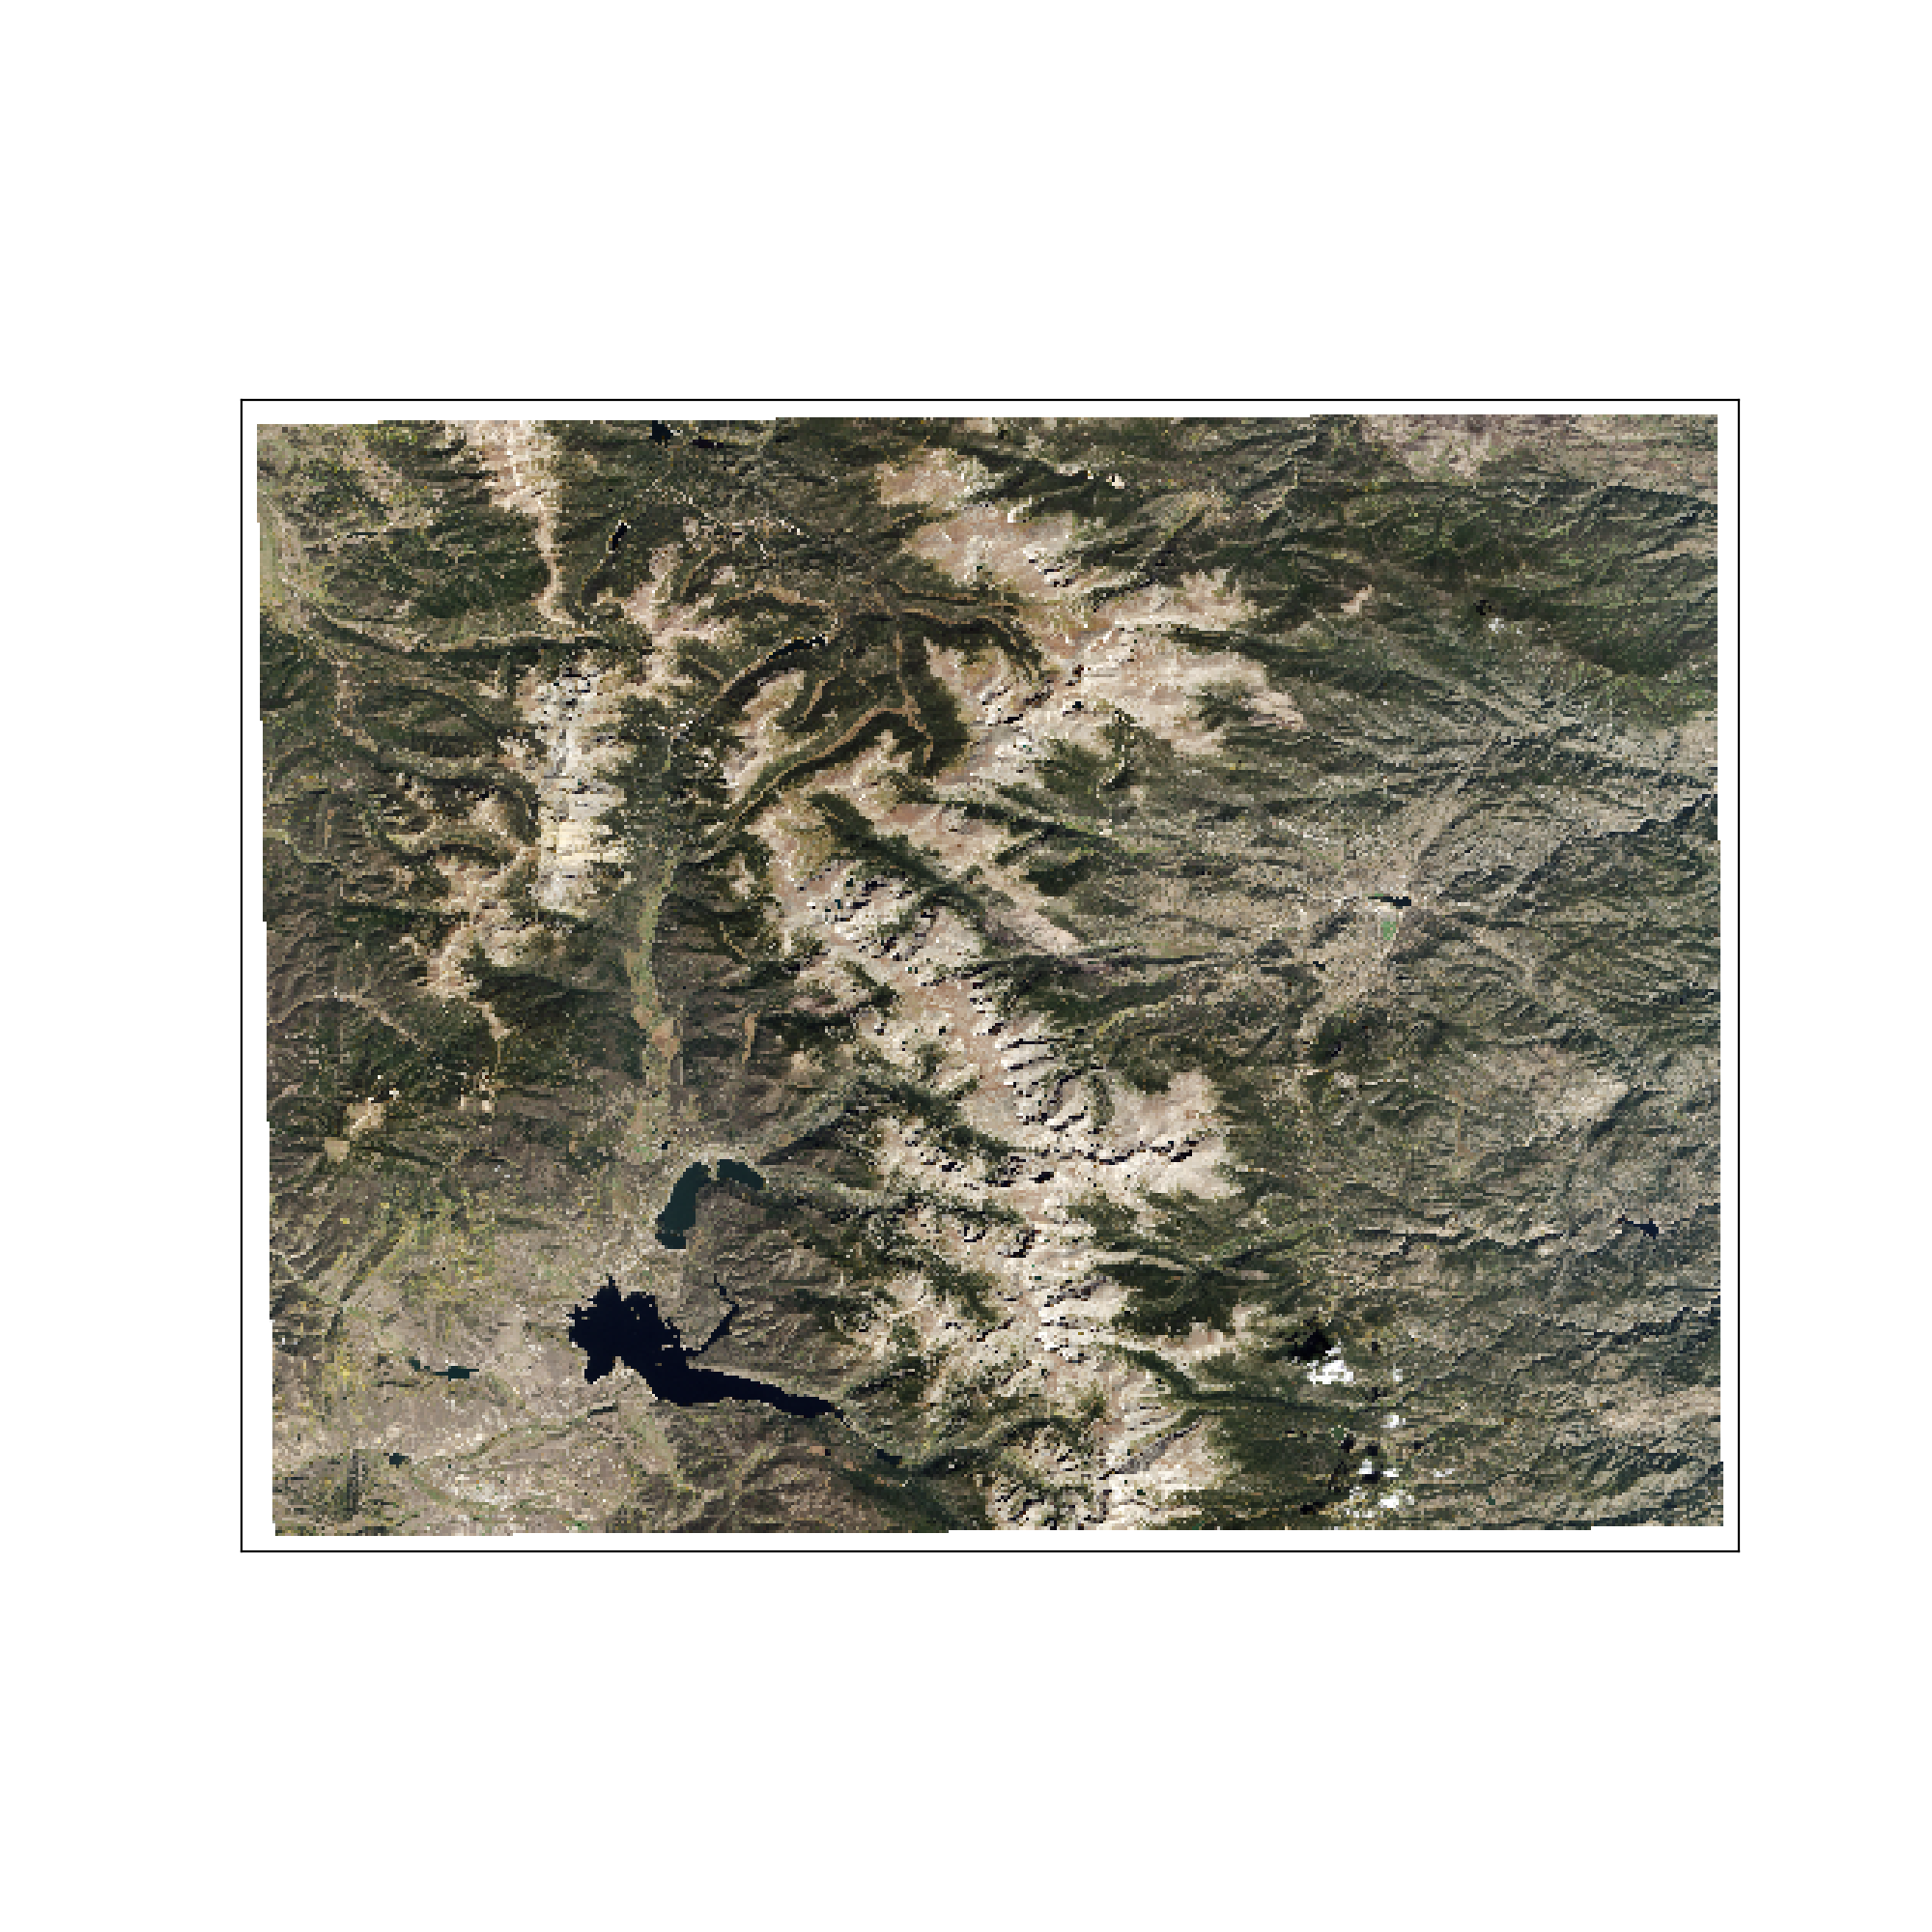
earthpy.plot.plot_rgb(arr, rgb=(0, 1, 2), figsize=(10, 10), str_clip=2, ax=None, extent=None, title='', stretch=None)[source]¶ Plot three bands in a numpy array as a composite RGB image.
- Parameters
arr (numpy array) – An n-dimensional array in rasterio band order (bands, rows, columns) containing the layers to plot.
rgb (list (default = (0, 1, 2))) – Indices of the three bands to be plotted.
figsize (tuple (default = (10, 10)) – The x and y integer dimensions of the output plot.
str_clip (int (default = 2)) – The percentage of clip to apply to the stretch. Default = 2 (2 and 98).
ax (object (optional)) – The axes object where the ax element should be plotted.
extent (tuple (optional)) – The extent object that matplotlib expects (left, right, bottom, top).
title (string (optional)) – The intended title of the plot.
stretch (Boolean (optional)) – Application of a linear stretch. If set to True, a linear stretch will be applied.
- Returns
ax – The axes object associated with the 3 band image.
- Return type
axes object
Example
>>> import matplotlib.pyplot as plt
>>> import rasterio as rio
>>> import earthpy.plot as ep
>>> from earthpy.io import path_to_example
>>> with rio.open(path_to_example('rmnp-rgb.tif')) as src:
...     img_array = src.read()
>>> # Before you plot, ensure that the input array does not have nodata values like -9999
>>> ep.plot_rgb(img_array)
<matplotlib.axes._subplots.AxesSubplot object at 0x...
(Source code, png, hires.png, pdf)
