Note
Click here to download the full example code
Clip Vector Data with EarthPy
Learn how to clip point, line, or polygon geometries to the country_boundary of a polygon geometry using EarthPy.
Clip Vector Data in Python Using EarthPy
Note
The example below will show you how to use the clip_shp() function to clip vector data such as points, lines and polygons to a vector boundary.
The example below walks you through a typical workflow for clipping one
vector data file to the shape of another. Both vector data files must be
opened with GeoPandas as GeoDataFrames and be in the same Coordinate
Reference System (CRS) for the clip_shp() function in EarthPy to work.
This example uses a line shapefile containing all major roads in North America and a polygon shapefile containing the United States boundary to show you how to prepare and clip vector data. In this example, the roads will be clipped to the United States boundary.
Note
The object to be clipped will be clipped to the full extent of the clip object. If there are multiple polygons in clip object, the input data will be clipped to the total boundary of all polygons in clip object.
Import Packages
To begin, import the needed packages. You will primarily use EarthPy’s clip utility alongside GeoPandas.
import os
import matplotlib.pyplot as plt
import geopandas as gpd
import earthpy as et
import earthpy.clip as ec
Import Example Data
Once the packages have been imported, download the data needed for this example: one line shapefile containing all major roads in North America, and one polygon shapefile containing the United States boundary.
data = et.data.get_data("spatial-vector-lidar")
Out:
Downloading from https://ndownloader.figshare.com/files/12459464
Extracted output to /home/docs/earth-analytics/data/spatial-vector-lidar/.
Open Files with GeoPandas and Reproject the Data
Start by setting your working directory. Then, import the data files to GeoDataFrames using GeoPandas.
Recall that the data must be in the same CRS in order to use the
clip_shp() function. If the data are not in the same CRS, be sure to use
the to_crs() function from GeoPandas to match the projects between the
two objects, as shown below.
# Set your home environment
os.chdir(os.path.join(et.io.HOME, "earth-analytics"))

# Open both files with GeoPandas
road_path = os.path.join(
    "data",
    "spatial-vector-lidar",
    "global",
    "ne_10m_roads",
    "ne_10m_n_america_roads.shp",
)
roads = gpd.read_file(road_path)

country_path = os.path.join(
    "data", "spatial-vector-lidar", "usa", "usa-boundary-dissolved.shp"
)
country_boundary = gpd.read_file(country_path)

# Reproject the roads layer to match the US boundary CRS
roads = roads.to_crs(country_boundary.crs)
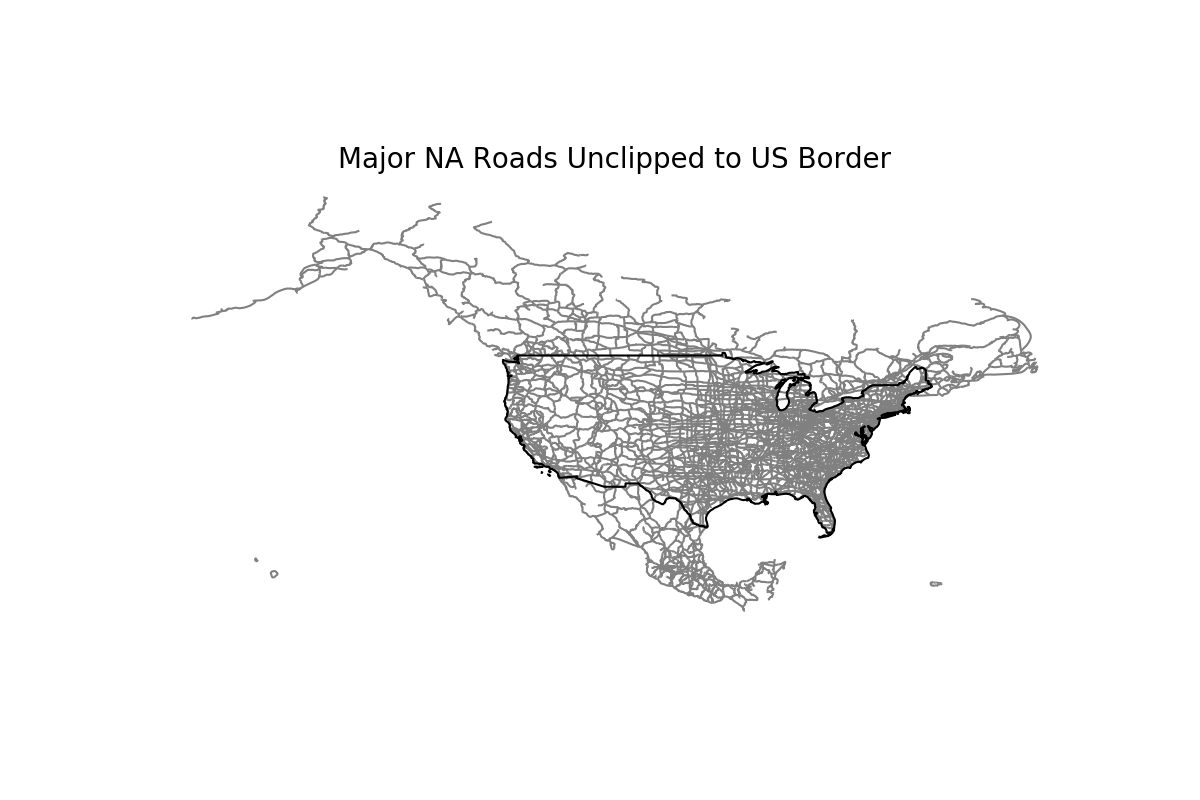
The plot below shows the roads data before it has been clipped. Notice that
the .boundary method for a GeoPandas object is used to plot the
boundary rather than the filled polygon. This allows for other data, such as
the roads data, to be overlayed on top of the polygon boundary.
fig, ax = plt.subplots(figsize=(12, 8))
roads.plot(ax=ax, color="grey")
country_boundary.boundary.plot(ax=ax, color="black")
ax.set_title("Major NA Roads Unclipped to US Border", fontsize=20)
ax.set_axis_off()
plt.show()
Clip the Data
Now that the data are opened as GeoDataFrame objects and in the same projection, the data can be clipped! Recall that in this example, the roads will be clipped to the United States boundary.
To clip the data, make
sure you put the object to be clipped as the first argument in
clip_shp(), followed by the vector object (boundary) to which you want
the first object clipped. The function will return the clipped GeoDataFrame
of the object that is being clipped (e.g. roads).
roads_clipped = ec.clip_shp(roads, country_boundary)
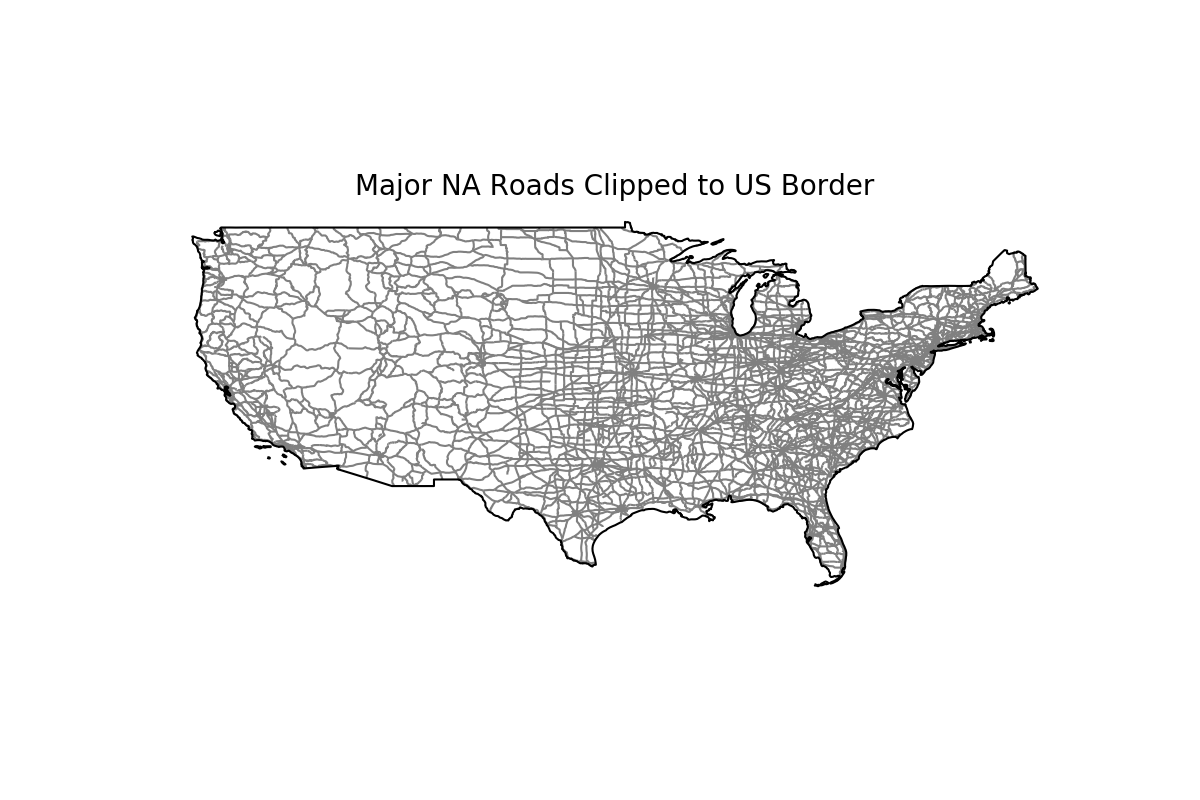
# Plot the clipped data
# The plot below shows the results of the clip function applied to the roads
# sphinx_gallery_thumbnail_number = 2
fig, ax = plt.subplots(figsize=(12, 8))
roads_clipped.plot(ax=ax, color="grey")
country_boundary.boundary.plot(ax=ax, color="black")
ax.set_title("Major NA Roads Clipped to US Border", fontsize=20)
ax.set_axis_off()
plt.show()
Total running time of the script: ( 1 minutes 20.692 seconds)