earthpy.spatial
Functions to manipulate spatial raster and vector data.
-
earthpy.spatial.bytescale(data, high=255, low=0, cmin=None, cmax=None)[source]¶ Byte scales an array (image).
Byte scaling converts the input image to uint8 dtype, and rescales the data range to
(low, high)(default 0-255). If the input image already has dtype uint8, no scaling is done. Source code adapted from scipy.misc.bytescale (deprecated in scipy-1.0.0)- Parameters
data (numpy array) – image data array.
high (int (default=255)) – Scale max value to high.
low (int (default=0)) – Scale min value to low.
cmin (int (optional)) – Bias scaling of small values. Default is
data.min().cmax (int (optional)) – Bias scaling of large values. Default is
data.max().
- Returns
img_array – The byte-scaled array.
- Return type
uint8 numpy array
Examples
>>> import numpy as np
>>> from earthpy.spatial import bytescale
>>> img = np.array([[ 91.06794177,   3.39058326,  84.4221549 ],
...                 [ 73.88003259,  80.91433048,   4.88878881],
...                 [ 51.53875334,  34.45808177,  27.5873488 ]])
>>> bytescale(img)
array([[255,   0, 236],
       [205, 225,   4],
       [140,  90,  70]], dtype=uint8)
>>> bytescale(img, high=200, low=100)
array([[200, 100, 192],
       [180, 188, 102],
       [155, 135, 128]], dtype=uint8)
>>> bytescale(img, cmin=0, cmax=255)
array([[255,   0, 236],
       [205, 225,   4],
       [140,  90,  70]], dtype=uint8)
-
earthpy.spatial.crop_all(raster_paths, output_dir, geoms, overwrite=False, all_touched=True, verbose=True)[source]¶ Takes a list of rasters and a boundary, and crops them efficiently.
- Parameters
raster_paths (list of file paths) – List of paths of rasters that will be cropped.
output_dir (string) – Provide a single directory path if you wish to specify the location of the output cropped files only. _crop will be appended to the file name for each output cropped image.
geoms (geopandas geodataframe or list of polygons) – The spatial polygon boundaries in GeoJSON-like dict format to be used to crop the image. All data outside of the polygon boundaries will be set to nodata and/or removed from the image.
overwrite (bool (default=False)) – Disallows files to be overwritten if they exist already. Can be changed so that files can be overwritten with each run of the function. If False, will not overwrite existing files. If true, existing files will be overwritten.
all_touched (bool (default=True)) – Include a pixel in the mask if it touches any of the shapes. If False, include a pixel only if its center i s within one of the shapes, or if it is selected by Bresenham’s line algorithm. (from rasterio)
verbose (bool (default=True)) –
- Returns a list of full file paths created by the function.
If set to false, returns nothing.
- Returns
return files – List of full file paths created by the function.
- Return type
list
Example
>>> import os
>>> import earthpy.spatial as es
>>> import geopandas as gpd
>>> from earthpy.io import path_to_example
>>> band_fnames = ["red.tif", "green.tif", "blue.tif"]
>>> band_paths = [path_to_example(fname) for fname in band_fnames]
>>> rmnp = gpd.read_file(path_to_example("rmnp.shp"))
>>> output_dir = os.path.commonpath(band_paths)
>>> output_files = es.crop_all(band_paths, output_dir, rmnp, overwrite=True)
>>> len(output_files)
3
>>> os.path.isfile(output_files[0])
True
>>> # Clean up example data
>>> for bands in output_files:
...     os.remove(bands)
-
earthpy.spatial.crop_image(raster, geoms, all_touched=True)[source]¶ Crop a single file using geometry objects.
- Parameters
raster (rasterio object) – The rasterio object to be cropped.
geoms (geopandas geodataframe or list of polygons) – The spatial polygon boundaries in GeoJSON-like dict format to be used to crop the image. All data outside of the polygon boundaries will be set to nodata and/or removed from the image.
all_touched (bool (default=True)) – Include a pixel in the mask if it touches any of the shapes. If False, include a pixel only if its center is within one of the shapes, or if it is selected by Bresenham’s line algorithm. (from rasterio)
- Returns
- out_image: cropped numpy array
A numpy array that is cropped to the geoms object extent with shape (bands, rows, columns)
- out_meta: dict
A dictionary containing updated metadata for the cropped raster, including extent (shape elements) and transform properties.
- Return type
tuple
Example
>>> import geopandas as gpd
>>> import rasterio as rio
>>> import earthpy.spatial as es
>>> from earthpy.io import path_to_example
>>> # Clip an RGB image to the extent of Rocky Mountain National Park
>>> rmnp = gpd.read_file(path_to_example("rmnp.shp"))
>>> with rio.open(path_to_example("rmnp-rgb.tif")) as raster:
...     src_image = raster.read()
...     out_image, out_meta = es.crop_image(raster, rmnp)
>>> out_image.shape
(3, 265, 281)
>>> src_image.shape
(3, 373, 485)
-
earthpy.spatial.extent_to_json(ext_obj)[source]¶ Convert bounds to a shapely geojson like spatial object.
This format is what shapely uses. The output object can be used to crop a raster image.
- Parameters
ext_obj (list or geopandas geodataframe) – If provided with a geopandas geodataframe, the extent will be generated from that. Otherwise, extent values should be in the order: minx, miny, maxx, maxy.
- Returns
extent_json (A GeoJSON style dictionary of corner coordinates)
for the extent – A GeoJSON style dictionary of corner coordinates representing the spatial extent of the provided spatial object.
Example
>>> import geopandas as gpd
>>> import earthpy.spatial as es
>>> from earthpy.io import path_to_example
>>> rmnp = gpd.read_file(path_to_example('rmnp.shp'))
>>> es.extent_to_json(rmnp)
{'type': 'Polygon', 'coordinates': (((-105.4935937, 40.1580827), ...),)}
-
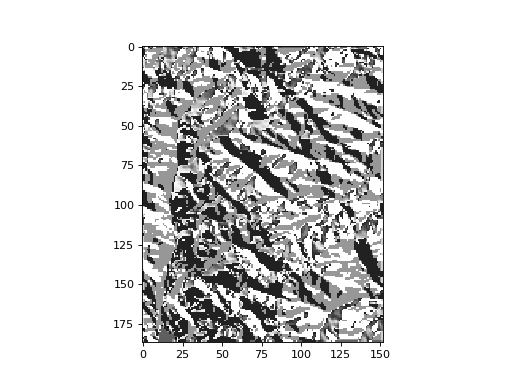
earthpy.spatial.hillshade(arr, azimuth=30, altitude=30)[source]¶ Create hillshade from a numpy array containing elevation data.
- Parameters
arr (numpy array of shape (rows, columns)) – Numpy array containing elevation values to be used to created hillshade.
azimuth (float (default=30)) – The desired azimuth for the hillshade.
altitude (float (default=30)) – The desired sun angle altitude for the hillshade.
- Returns
A numpy array containing hillshade values.
- Return type
numpy array
Example
>>> import matplotlib.pyplot as plt
>>> import rasterio as rio
>>> import earthpy.spatial as es
>>> from earthpy.io import path_to_example
>>> with rio.open(path_to_example('rmnp-dem.tif')) as src:
...     dem = src.read()
>>> print(dem.shape)
(1, 187, 152)
>>> squeezed_dem = dem.squeeze() # remove first dimension
>>> print(squeezed_dem.shape)
(187, 152)
>>> shade = es.hillshade(squeezed_dem)
>>> plt.imshow(shade, cmap="Greys")
<matplotlib.image.AxesImage object at 0x...>
(Source code, png, hires.png, pdf)

-
earthpy.spatial.normalized_diff(b1, b2)[source]¶ Take two n-dimensional numpy arrays and calculate the normalized difference.
Math will be calculated (b1-b2) / (b1 + b2).
- Parameters
b2 (b1,) – Two numpy arrays that will be used to calculate the normalized difference. Math will be calculated (b1-b2) / (b1+b2).
- Returns
n_diff – The element-wise result of (b1-b2) / (b1+b2) calculation. Inf values are set to nan. Array returned as masked if result includes nan values.
- Return type
numpy array
Examples
>>> import numpy as np
>>> import earthpy.spatial as es
>>> # Calculate normalized difference vegetation index
>>> nir_band = np.array([[6, 7, 8, 9, 10], [16, 17, 18, 19, 20]])
>>> red_band = np.array([[1, 2, 3, 4, 5], [11, 12, 13, 14, 15]])
>>> ndvi = es.normalized_diff(b1=nir_band, b2=red_band)
>>> ndvi
array([[0.71428571, 0.55555556, 0.45454545, 0.38461538, 0.33333333],
       [0.18518519, 0.17241379, 0.16129032, 0.15151515, 0.14285714]])
>>> # Calculate normalized burn ratio
>>> nir_band = np.array([[8, 10, 13, 17, 15], [18, 20, 22, 23, 25]])
>>> swir_band = np.array([[6, 7, 8, 9, 10], [16, 17, 18, 19, 20]])
>>> nbr = es.normalized_diff(b1=nir_band, b2=swir_band)
>>> nbr
array([[0.14285714, 0.17647059, 0.23809524, 0.30769231, 0.2       ],
       [0.05882353, 0.08108108, 0.1       , 0.0952381 , 0.11111111]])
-
earthpy.spatial.stack(band_paths, out_path='', nodata=None)[source]¶ Convert a list of raster paths into a raster stack numpy darray.
- Parameters
band_paths (list of file paths) – A list with paths to the bands to be stacked. Bands will be stacked in the order given in this list.
out_path (string (optional)) – A path with a file name for the output stacked raster tif file.
nodata (numeric (optional)) – A value (int or float) that represents invalid or missing values to mask in the output.
- Returns
- numpy array
N-dimensional array created by stacking the raster files provided.
- rasterio profile object
A rasterio profile object containing the updated spatial metadata for the stacked numpy array.
- Return type
tuple
Example
>>> import os
>>> import earthpy.spatial as es
>>> from earthpy.io import path_to_example
>>> band_fnames = ["red.tif", "green.tif", "blue.tif"]
>>> band_paths = [path_to_example(fname) for fname in band_fnames]
>>> destfile = "./stack_result.tif"
>>> arr, arr_meta = es.stack(band_paths, destfile)
>>> arr.shape
(3, 373, 485)
>>> os.path.isfile(destfile)
True
>>> # optionally, clean up example output
>>> os.remove(destfile)